
XRP Price News: Drops 5% to $2.47 as Bears Break Key Support Level
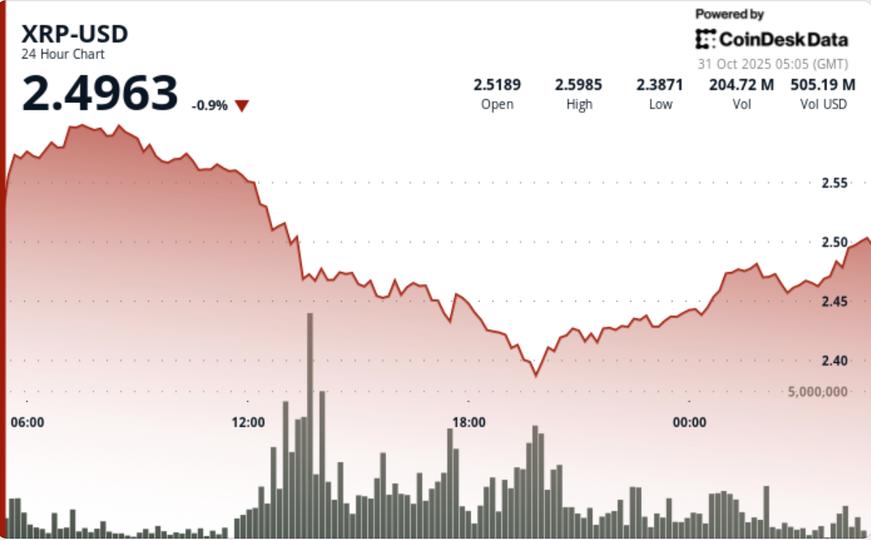
ReadXRP broke below the $2.50 support during Tuesday’s session, sliding 5% to $2.47 as institutional selling pressure accelerated across major exchanges. The breakdown confirmed a decisive shift in structure following weeks of tight consolidation, with volume and chart patterns now aligning toward a deeper corrective phase.News BackgroundThe token’s 24-hour session saw prices tumble from $2.60 to $2.47, marking one of the largest single-day declines this month.The breach of the $2.50 psychological level triggered a wave of algorithmic and institutional selling, propelling trading activity to 169 million tokens, up 158% versus the 24-hour average.XRP’s market underperformance contrasts with broader crypto strength, suggesting rotation away from altcoins as risk appetite cools amid waning speculative participation.The breakdown reinforced strong overhead resistance at $2.60, where repeated rejection points over recent weeks had capped upside momentum.Price Action SummaryThe selloff unfolded in structured phases through Tuesday’s trading. The initial breakdown began at 13:00 UTC, when heavy sell volume drove price decisively through the $2.50 support, igniting a cascade that extended to intraday lows near $2.38.Subsequent price stabilization formed around the $2.43–$2.46 range, suggesting the early stages of a potential consolidation base.Short-term momentum readings indicated exhaustion as volume tapered into the close, a dynamic often preceding interim pauses in trending declines.On the microstructure level, 60-minute data showed two distinct distribution waves as XRP slipped from $2.472 to $2.466.Successive hourly volume spikes of 2.8M and 2.6M tokens—each exceeding 300% of hourly averages—confirmed continued institutional control over intraday flows.Technical AnalysisXRP’s breakdown marks a continuation of its lower-high, lower-low structure that began after the failed retest of the $2.60 resistance.The session’s 8.8% volatility range underscores aggressive liquidation and profit-taking from larger holders, aligning with recent on-chain signals of exchange inflows.Momentum indicators such as RSI have shifted into neutral-to-bearish territory, while MACD shows expanding downside divergence. The $2.40–$2.42 area now acts as immediate technical support, and a close below this band could open further downside toward $2.30–$2.33.Volume analytics remain pivotal— the 169M turnover during breakdown confirms institutional participation rather than retail panic, while declining late-session activity implies that the bulk of distribution may already be complete.What Traders Should Watch