
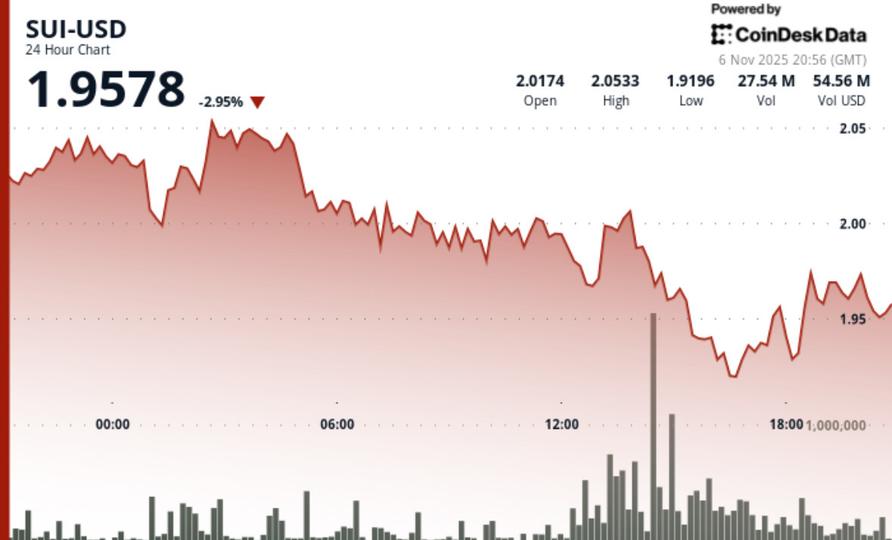
SUI Falls Below $2.00 Support as Volume Spikes and Traders Eye Key Reversal Pattern
ReadSUI, the native token of the Layer-1 blockchain Sui, dropped 2.5% to $1.98 on Thursday, slipping below the $2.00 level that had acted as a key psychological and technical support.STORY CONTINUES BELOW Don't miss another story. Subscribe to the Crypto Daybook Americas Newsletter today . See all newsletters Sign me up By signing up, you will receive emails about CoinDesk products and you agree to our terms of use and privacy policy .The move came amid heightened volatility and a notable spike in trading volume, pointing to growing institutional activity near critical price levels.The token's price fell from an intraday high of $2.03, forming a series of lower highs across a $0.15 range. Trading volume surged to 31.18 million tokens — about 180% higher than the daily average — during a failed bounce attempt at the $1.96 mark. That bounce coincided with strong resistance at $2.05, which was tested and rejected several times.This activity, especially during the midday selloff, suggests that larger players may have been actively repositioning during the weakness. Institutional volume can often intensify moves near support or resistance, which appeared to be the case here.Still, shorter time-frame data showed signs of a possible turnaround. A double-bottom pattern formed near $1.952 on the 60-minute chart, followed by a rally to $1.978. A breakout above $1.970 triggered another spike in volume — 641,000 tokens — indicating renewed buyer interest into the close.The $1.93–$1.96 zone now serves as near-term support, while $2.05 remains the next upside target. If buyers can sustain momentum above $1.970, SUI may attempt to retest that level. A break below $1.93, however, could accelerate losses and lead to a deeper correction. For now, the chart suggests short-term consolidation, with bulls and bears battling for control near a critical technical threshold.