
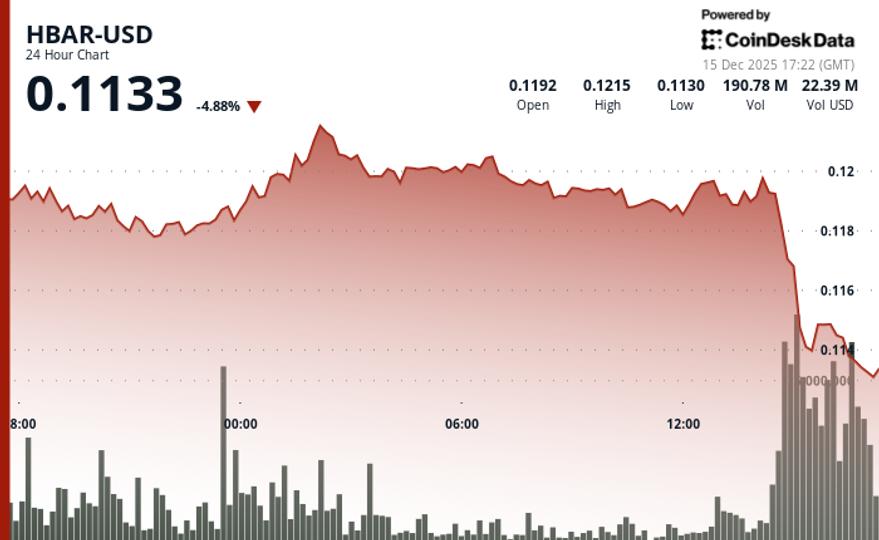
HBAR Slides to Lowest Point in a Year as Crypto Market Plunges
ReadHedera plunged through key support levels during Sunday's session, declining 5.8% from $0.1202 to $0.1127 as technical selling pressure overwhelmed early buying interest.The cryptocurrency established a clear bearish structure after failing to hold gains above $0.1218, with price action dominated by profit-taking near resistance levels.STORY CONTINUES BELOW Don't miss another story. Subscribe to the Crypto Daybook Americas Newsletter today . See all newsletters Sign me up By signing up, you will receive emails about CoinDesk products and you agree to our terms of use and privacy policy .Volume patterns told the story of capital flows throughout the session. Trading activity exploded to 69.18 million tokens on Dec. 14 at 20:00 UTC, marking an 86% surge above the 24 hour average of 32.8 million tokens—as HBAR tested critical resistance near $0.1194.The rejection triggered a cascade of selling that drove prices through established support levels, with subsequent sessions showing declining volume that signaled diminished institutional participation.With institutional flows having driven both the initial selloff and late-session recovery, technical levels at $0.1194 resistance became the critical battleground for HBAR's near-term direction.Aside from a momentary spike during October's liquidation event, HBAR is now trading at its lowest point since November, 2024.HBAR/USD (TradingView)Key Technical Levels Signal Mixed Outlook for HBARSupport/Resistance: Critical resistance holds at $0.1194 following high-volume rejection, with fresh support established at $0.1121 after late-session reversal. Deeper support remains at $0.11.Volume Analysis: Peak volume of 69.18 million tokens validated resistance level integrity, while 750% volume spike at session close indicated renewed institutional interest after period of declining participation.Chart Patterns: Descending trendline from $0.1218 high broken, though price remains within established consolidation range between $0.1129-$0.1193 formed over the session.Targets & Risk/Reward: Breakout above $0.1194 resistance targets previous high near $0.1218, offering upside potential, while failure to maintain $0.1121 support risks retest of $0.11 level.Disclaimer: Parts of this article were generated with the assistance from AI tools and reviewed by our editorial team to ensure accuracy and adherence to our standards. For more information, see CoinDesk's full AI Policy.