
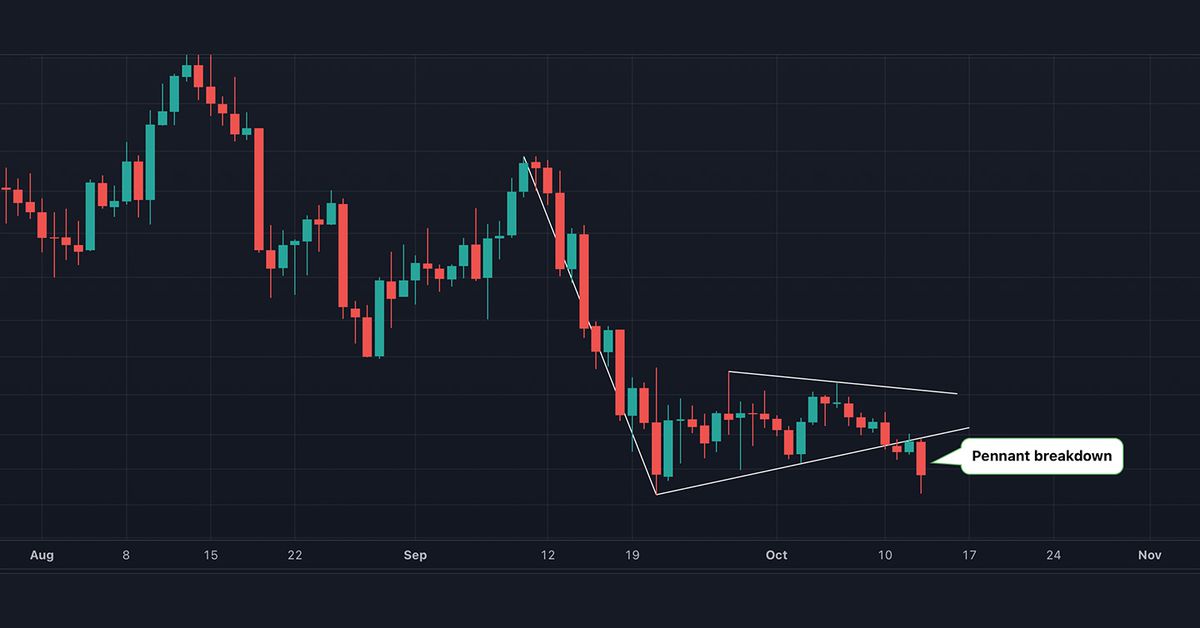
Ether Exits Triangular Price Consolidation With 4% Drop
ReadA logarithmic scale chart plots values between two points according to the percent change rather than the absolute change and is suitable for data with vast value disparity. For instance, ether has gone from being valued in two digits in March 2020 to four digits at press time. Technical analysts often use log charts to analyze long-term trends.