
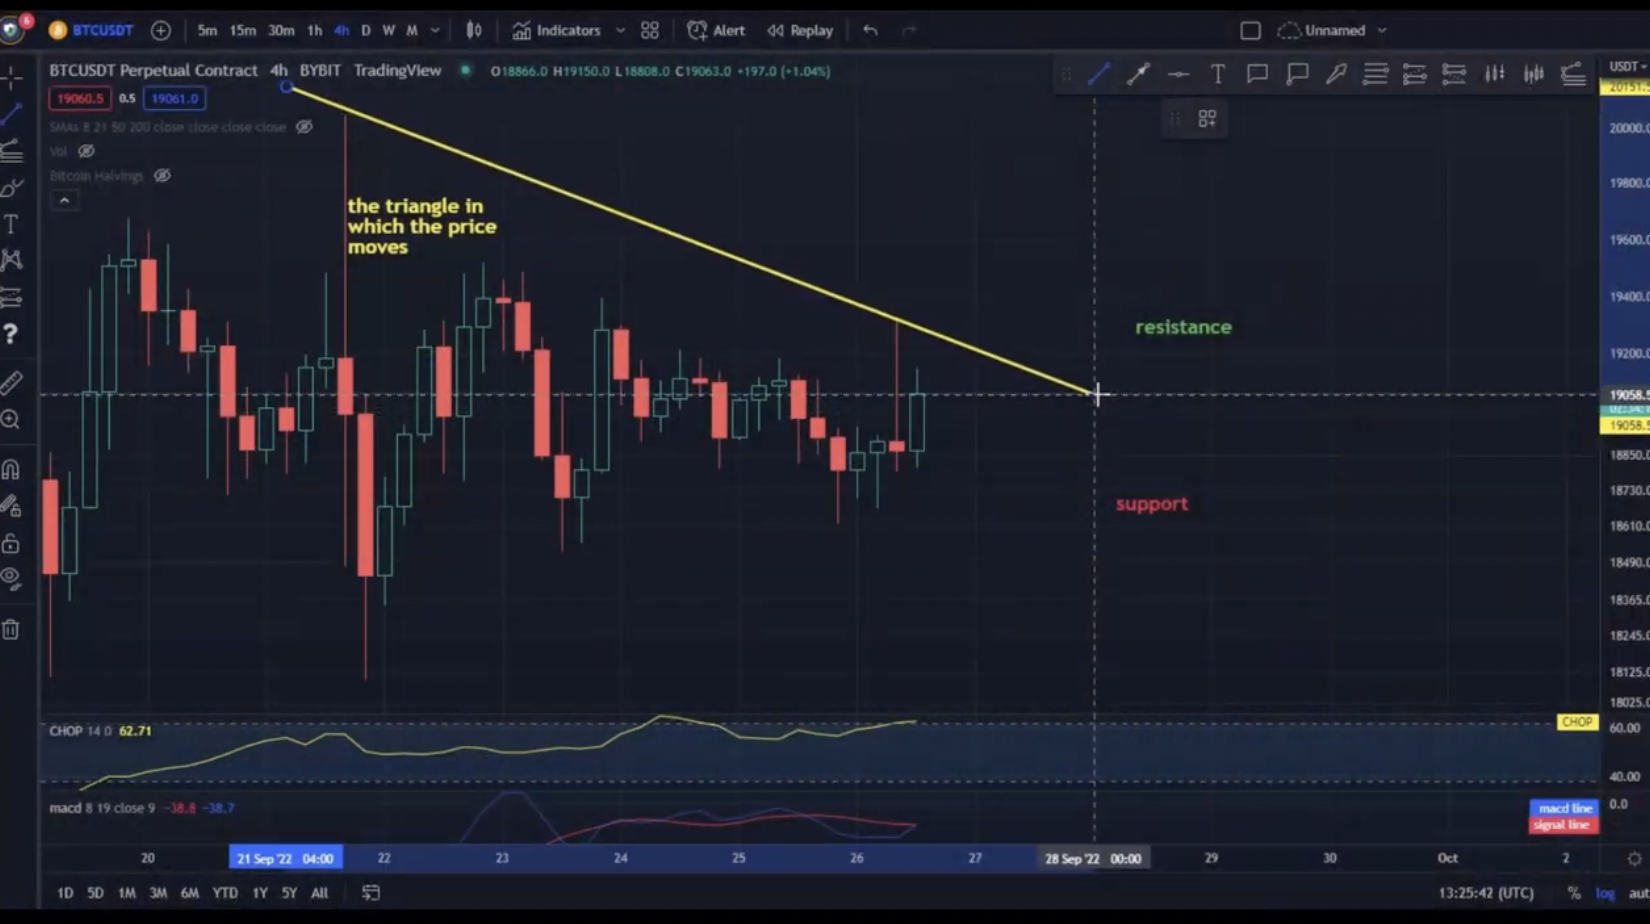
Bitcoin (BTC) to USDT chart over the 4 hour timeframe on 26/09/2022
ReadHello everyone, let's take a look at the Bitcoin (BTC) to USDT chart over the 4 hour timeframe. As you can see, the price moves in the triangle marked with yellow lines.Let's start by marking the resistance line, as you can see, the first resistance is $ 19,069, if you can break it, the next resistance will be $ 19,149, $ 19,234 and $ 19,351.Now let's move to the support line and as you can see the first support in the near future is $ 19,023, if the support breaks down, the next support is $ 19,023, $ 18,950 and $ 18,822.Looking at the CHOP indicator, we can see that in the 4-hour interval we have a lot of energy, and the MACD indicator shows a local upward trend.Disclaimer: Technical Analysis is provided by a third party, and for informational purposes only. It does not reflect the views of Crypto Daily, nor is it intended to be used as legal, tax, investment, or financial advice.