
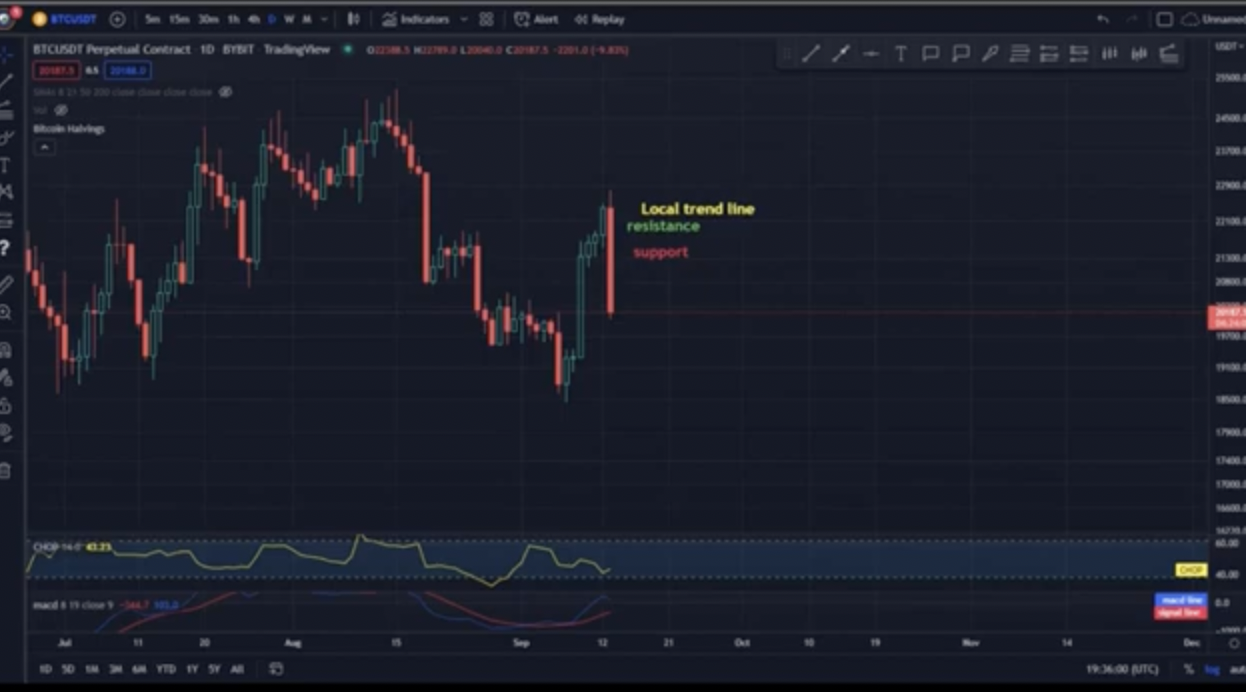
Bitcoin (BTC) to USDT chart on a 1 day time frame on 13.09.2022.
ReadHello everyone, let's take a look at the Bitcoin (BTC) to USDT chart on a 1 day time frame on 13.09.2022. As you can see, the price is moving below the local uptrend line.Let's start with the designation of the support line and as you can see the first support where the price is currently at is $ 20.02, if the support breaks, the next support is $ 19,401 and $ 18,618.Now let's move from the resistance line as you can see the first resistance is $ 21,068, if you can break it the next resistance will be $ 21,737, $ 22,223 and $ 22,738.Looking at the CHOP indicator, we can see that on the 1-day interval, the energy slowly begins to increase, while the MACD indicator shows that despite the decline, we are in an upward trend.