
$BCH News: BCH Clears $550 on Heavy Volume; $547 Flips to Support as Range Narrows
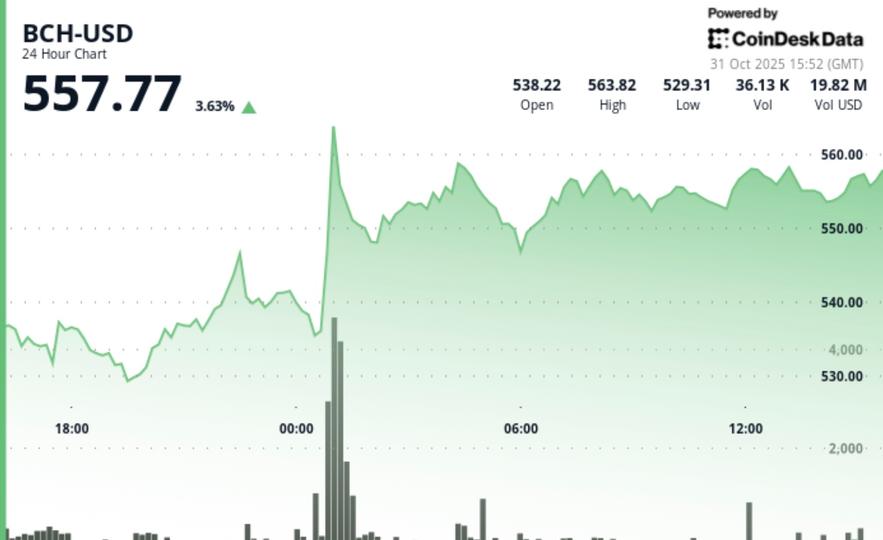
ReadAccording to CoinDesk Research technical analysis data model, BCH $ 555.06 pushed through $550 on a heavy-volume burst, then cooled into a tight band as traders gauged whether the new support would stick.Technical analysis highlightsPath and result: BCH climbed from $540.24 to $554.52 for a 2.6% session gain, establishing higher lows and confirming an uptrend structure.Breakout timing: The push began in Asian hours when price broke $547 at 1 a.m. UTC; the breakout candle printed 130,078 units.Volume context: During the move above $550, trading ran 328% above average, signaling strong participation behind the breakout.Post-move check: A pullback to $553.58 in the latest hour tested the area just above the breakout zone.Weekly context (vs BTC): The model notes weekly gains of 4.8% for BCH against a 1.2% decline for bitcoin over the same span.What the patterns meanBreakout with confirmation: Breaking $547 first and $550 next, with heavy activity, tells you buyers weren’t alone—there was depth behind the move.Fresh support test: A quick dip to $553.58 after the breakout is a normal “check” to see if new buyers defend the level; $553.50 is the line the model is watching.Constructive structure: The model’s higher lows at $528.55 and $534.36 and an ascending trendline from Oct. 30 remain intact, even as a lower high from $558.25 is on watch.Support and resistance mapSupport (nearest): $553.50 (freshly tested).Support (breakout retest): $547 (resistance-turned-support).Trend reference: Ascending line from Oct. 30 sits above $534; prior higher lows at $534.36 and $528.55.Resistance (immediate): $558.25 (prior high).Near-term band: $553 to $556 defines the current consolidation box.Volume picturePeak bar: 130,078 units at 1 a.m. UTC on the $547 breach.Breakout participation: +328% vs. average during the run through $550.After the push: The model notes elevated activity even on the small pullback, consistent with active price discovery.Positioning signalsOptions interest: The model highlights rising call interest at the $560 and $575 November strikes, consistent with traders mapping upside checkpoints (this is positioning color, not a forecast).Risk framingIf support holds: The $558.25 prior high is the immediate checkup (about 0.9% from the session settlement cited in the model).If support fails: A loss of $553.50 could invite a $547 retest (the breakout level now viewed as support).Stop-zone reference: The model flags below $534.36 as a logical line for risk control within the uptrend structure.CoinDesk 5 Index (CD5) contextCD5 window: Oct. 30, 3 p.m. UTC, to Oct. 31, 2 p.m. UTC — CD5 rose 1.43% to $1,920.74, with a push above $1,920 during 4–5 a.m. UTC and a 4.34% daily range, indicating active price discovery across majors.STORY CONTINUES BELOW Don't miss another story. Subscribe to the Crypto Daybook Americas Newsletter today . See all newsletters Sign me up By signing up, you will receive emails about CoinDesk products and you agree to our terms of use and privacy policy .Disclaimer: Parts of this article were generated with the assistance from AI tools and reviewed by our editorial team to ensure accuracy and adherence to our standards. For more information, see CoinDesk's full AI Policy.